※ 결과값에 대한 상세한 분석은 소개하지 않는다. 그 몫은 각자에게 맡기며, 여기서는 프로그램에 대한
소개와 실행방법, 그리고 결과값 출력에 대해서만 언급하고자 한다.
MySQL 튜닝값을 탐지해주는 유용한 툴이 있어 같이 공유하고자 소개합니다.
두 가지 툴 모두 간단하게 다운로드 받아 설치과정 없이 실행만 하면, 결과 값을 얻을 수가 있습니다.
1) tuning-primer.sh
쉘 스크립트 소스로 구성되어 있음.
# wget http://www.day32.com/MySQL/tuning-primer.sh
# chmod +x tuning-primer.sh 또는 sh tuning-primer.sh 로 바로 실행
# ./tuning-primer.sh
Using login values from ~/.my.cnf
- INITIAL LOGIN ATTEMPT FAILED -
Testing for stored webmin passwords: None Found
Could not auto detect login info!
Found Sockets:
/tmp/mysql.sock
Using: /tmp/mysql.sock
Would you like to provide a different socket?: [y/N] ----------> enter 로 skip 진행함.
Do you have your login handy ? [y/N] : -----------> 로그인이 걸려 있으므로 y 로 진행함.
User: 계정정보 입력
Password: 계정정보 입력
Would you like me to create a ~/.my.cnf file for you? [y/N] : ------------> 위 정보값을 .my.cnf 에 넣어두겠느냐? enter 로 skip 진행
y 로 진행하는 경우 .my.cnf 파일에 다음 내용이 기록되니 보안을 위해서는 skip 하도록 함.
[client]
user=계정id
password=계정pw
socket=/tmp/mysql.sock
이후 아래와 같이 결과값 출력
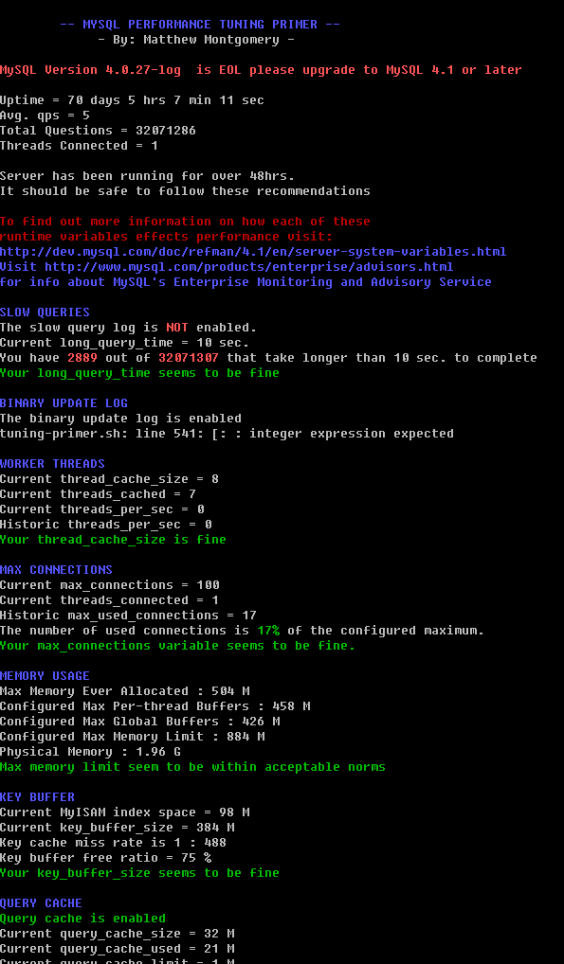
> 현재 값이 괜찮은 항목에 대해서는 연한녹색으로 표시
> 현재 값보다 튜닝이 필요한 항목에 대해서는 붉은색 계열로 표시
=================================================
-- MYSQL PERFORMANCE TUNING PRIMER --
- By: Matthew Montgomery -
MySQL Version 4.0.27-log is EOL please upgrade to MySQL 4.1 or later
Uptime = 70 days 5 hrs 7 min 11 sec
Avg. qps = 5
Total Questions = 32071286
Threads Connected = 1
Server has been running for over 48hrs.
It should be safe to follow these recommendations
To find out more information on how each of these
runtime variables effects performance visit:
http://dev.mysql.com/doc/refman/4.1/en/server-system-variables.html
Visit http://www.mysql.com/products/enterprise/advisors.html
for info about MySQL's Enterprise Monitoring and Advisory Service
SLOW QUERIES
The slow query log is NOT enabled.
Current long_query_time = 10 sec.
You have 2889 out of 32071307 that take longer than 10 sec. to complete
Your long_query_time seems to be fine
BINARY UPDATE LOG
The binary update log is enabled
tuning-primer.sh: line 541: [: : integer expression expected
WORKER THREADS
Current thread_cache_size = 8
Current threads_cached = 7
Current threads_per_sec = 0
Historic threads_per_sec = 0
Your thread_cache_size is fine
MAX CONNECTIONS
Current max_connections = 100
Current threads_connected = 1
Historic max_used_connections = 17
The number of used connections is 17% of the configured maximum.
Your max_connections variable seems to be fine.
MEMORY USAGE
Max Memory Ever Allocated : 504 M
Configured Max Per-thread Buffers : 458 M
Configured Max Global Buffers : 426 M
Configured Max Memory Limit : 884 M
Physical Memory : 1.96 G
Max memory limit seem to be within acceptable norms
KEY BUFFER
Current MyISAM index space = 98 M
Current key_buffer_size = 384 M
Key cache miss rate is 1 : 488
Key buffer free ratio = 75 %
Your key_buffer_size seems to be fine
QUERY CACHE
Query cache is enabled
Current query_cache_size = 32 M
Current query_cache_used = 21 M
Current query_cache_limit = 1 M
Current Query cache Memory fill ratio = 68.09 %
%yellow
No query_cache_min_res_unit is defined. Using MySQL < 4.1 cache fragmentation can be inpredictable
MySQL won't cache query results that are larger than query_cache_limit in size
SORT OPERATIONS
Current sort_buffer_size = 2 M
Current read_rnd_buffer_size = 256 K
Sort buffer seems to be fine
JOINS
Current join_buffer_size = 132.00 K
You have had 669 queries where a join could not use an index properly
You should enable "log-long-format"
Then look for non indexed joins in the slow query log.
If you are unable to optimize your queries you may want to increase your
join_buffer_size to accommodate larger joins in one pass.
Note! This script will still suggest raising the join_buffer_size when
ANY joins not using indexes are found.
OPEN FILES LIMIT
Current open_files_limit = 1134 files
The open_files_limit should typically be set to at least 2x-3x
that of table_cache if you have heavy MyISAM usage.
You currently have open more than 75% of your open_files_limit
You should set a higher value for open_files_limit in my.cnf
TABLE CACHE
Current table_cache value = 512 tables
You have a total of 6623 tables
You have 512 open tables.
Current table_cache hit rate is 0%, while 100% of your table cache is in use
You should probably increase your table_cache
TEMP TABLES
Current max_heap_table_size = 16 M
Current tmp_table_size = 32 M
Of 100119 temp tables, 4% were created on disk
Effective in-memory tmp_table_size is limited to max_heap_table_size.
Created disk tmp tables ratio seems fine
TABLE SCANS
Current read_buffer_size = 1 M
Current table scan ratio = 253 : 1
read_buffer_size seems to be fine
TABLE LOCKING
Current Lock Wait ratio = 1 : 2166
You may benefit from selective use of InnoDB.
If you have long running SELECT's against MyISAM tables and perform
frequent updates consider setting 'low_priority_updates=1'
=================================================
2) mysqltuner.pl
펄 소스로 구성되어 있음.
# wget http://mysqltuner.pl/mysqltuner.pl
# perl mysqltuner.pl
>> MySQLTuner 1.0.1 - Major Hayden <major@mhtx.net>
>> Bug reports, feature requests, and downloads at http://mysqltuner.com/
>> Run with '--help' for additional options and output filtering
Please enter your MySQL administrative login: root계정
Please enter your MySQL administrative password: root패스워드
인증과정 없이는 실행할 수 없다.
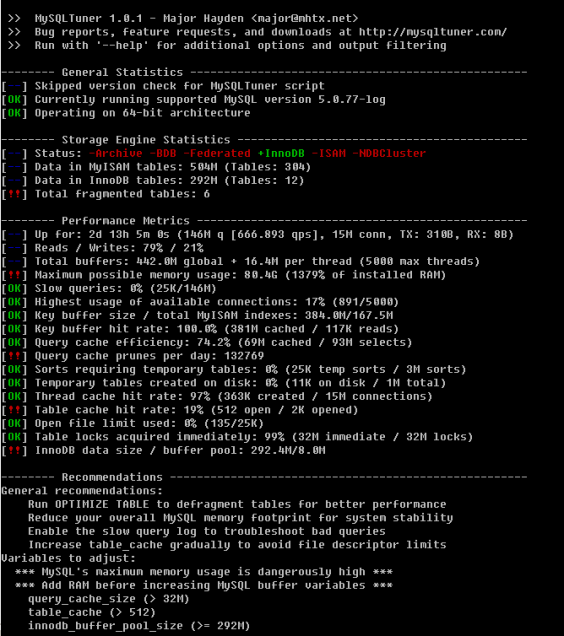
이 프로그램 툴 역시 색상으로 구분해주므로, 어디가 그렇고 그런지 파악하기 쉽게 되어 있다.
특히 말머리에 !!, OK 만으로도 상태가 어떤지는 알 것이다.
Recommendations 부분에는 어떻게 튜닝해줘야 하는지 어드바이스까지 해준다.
=================================================
>> MySQLTuner 1.0.1 - Major Hayden <major@mhtx.net>
>> Bug reports, feature requests, and downloads at http://mysqltuner.com/
>> Run with '--help' for additional options and output filtering
-------- General Statistics --------------------------------------------------
[--] Skipped version check for MySQLTuner script
[OK] Currently running supported MySQL version 5.0.77-log
[OK] Operating on 64-bit architecture
-------- Storage Engine Statistics -------------------------------------------
[--] Status: -Archive -BDB -Federated +InnoDB -ISAM -NDBCluster
[--] Data in MyISAM tables: 493M (Tables: 304)
[--] Data in InnoDB tables: 282M (Tables: 12)
[!!] Total fragmented tables: 5
-------- Performance Metrics -------------------------------------------------
[--] Up for: 1d 19h 32m 14s (110M q [704.797 qps], 11M conn, TX: 238B, RX: 6B)
[--] Reads / Writes: 79% / 21%
[--] Total buffers: 442.0M global + 16.4M per thread (5000 max threads)
[!!] Maximum possible memory usage: 80.4G (1379% of installed RAM)
[OK] Slow queries: 0% (4K/110M)
[OK] Highest usage of available connections: 15% (781/5000)
[OK] Key buffer size / total MyISAM indexes: 384.0M/163.0M
[OK] Key buffer hit rate: 100.0% (305M cached / 95K reads)
[OK] Query cache efficiency: 74.0% (52M cached / 71M selects)
[!!] Query cache prunes per day: 159148
[OK] Sorts requiring temporary tables: 0% (21K temp sorts / 2M sorts)
[OK] Temporary tables created on disk: 0% (8K on disk / 937K total)
[OK] Thread cache hit rate: 97% (269K created / 11M connections)
[OK] Table cache hit rate: 33% (512 open / 1K opened)
[OK] Open file limit used: 2% (680/25K)
[OK] Table locks acquired immediately: 99% (24M immediate / 24M locks)
[!!] InnoDB data size / buffer pool: 282.4M/8.0M
-------- Recommendations -----------------------------------------------------
General recommendations:
Run OPTIMIZE TABLE to defragment tables for better performance
Reduce your overall MySQL memory footprint for system stability
Enable the slow query log to troubleshoot bad queries
Variables to adjust:
*** MySQL's maximum memory usage is dangerously high ***
*** Add RAM before increasing MySQL buffer variables ***
query_cache_size (> 32M)
innodb_buffer_pool_size (>= 282M)
=================================================
< tuning-primer.sh 실행 화면 >

< mysqltuner.pl 실행 화면 >


